We looked at 5M GLP-1 prescriptions over two years and thousands of patients by SDOH risk. It raised an open question: why does GLP-1 utilization vary so much more for obesity than diabetes? HINT: finances may not tell the whole story.
How We Measured GLP-1 Access Across Neighborhood Risk Levels
GLP-1 coverage works for diabetes. For obesity, it doesn't.
GLP-1 use has surged over the past two years. The medications demonstrate real clinical effectiveness for both diabetes and obesity.
As utilization grows, so do questions about who gets treated. The assumption often runs that access follows affluence: people with more resources have an easier time getting these medications. Does that pattern hold? And does it hold equally across different diagnoses?
Our analysis covers nearly 5 million GLP-1 prescriptions across two years of employer-sponsored health coverage. Everyone in this dataset has insurance. What varies is neighborhood context.
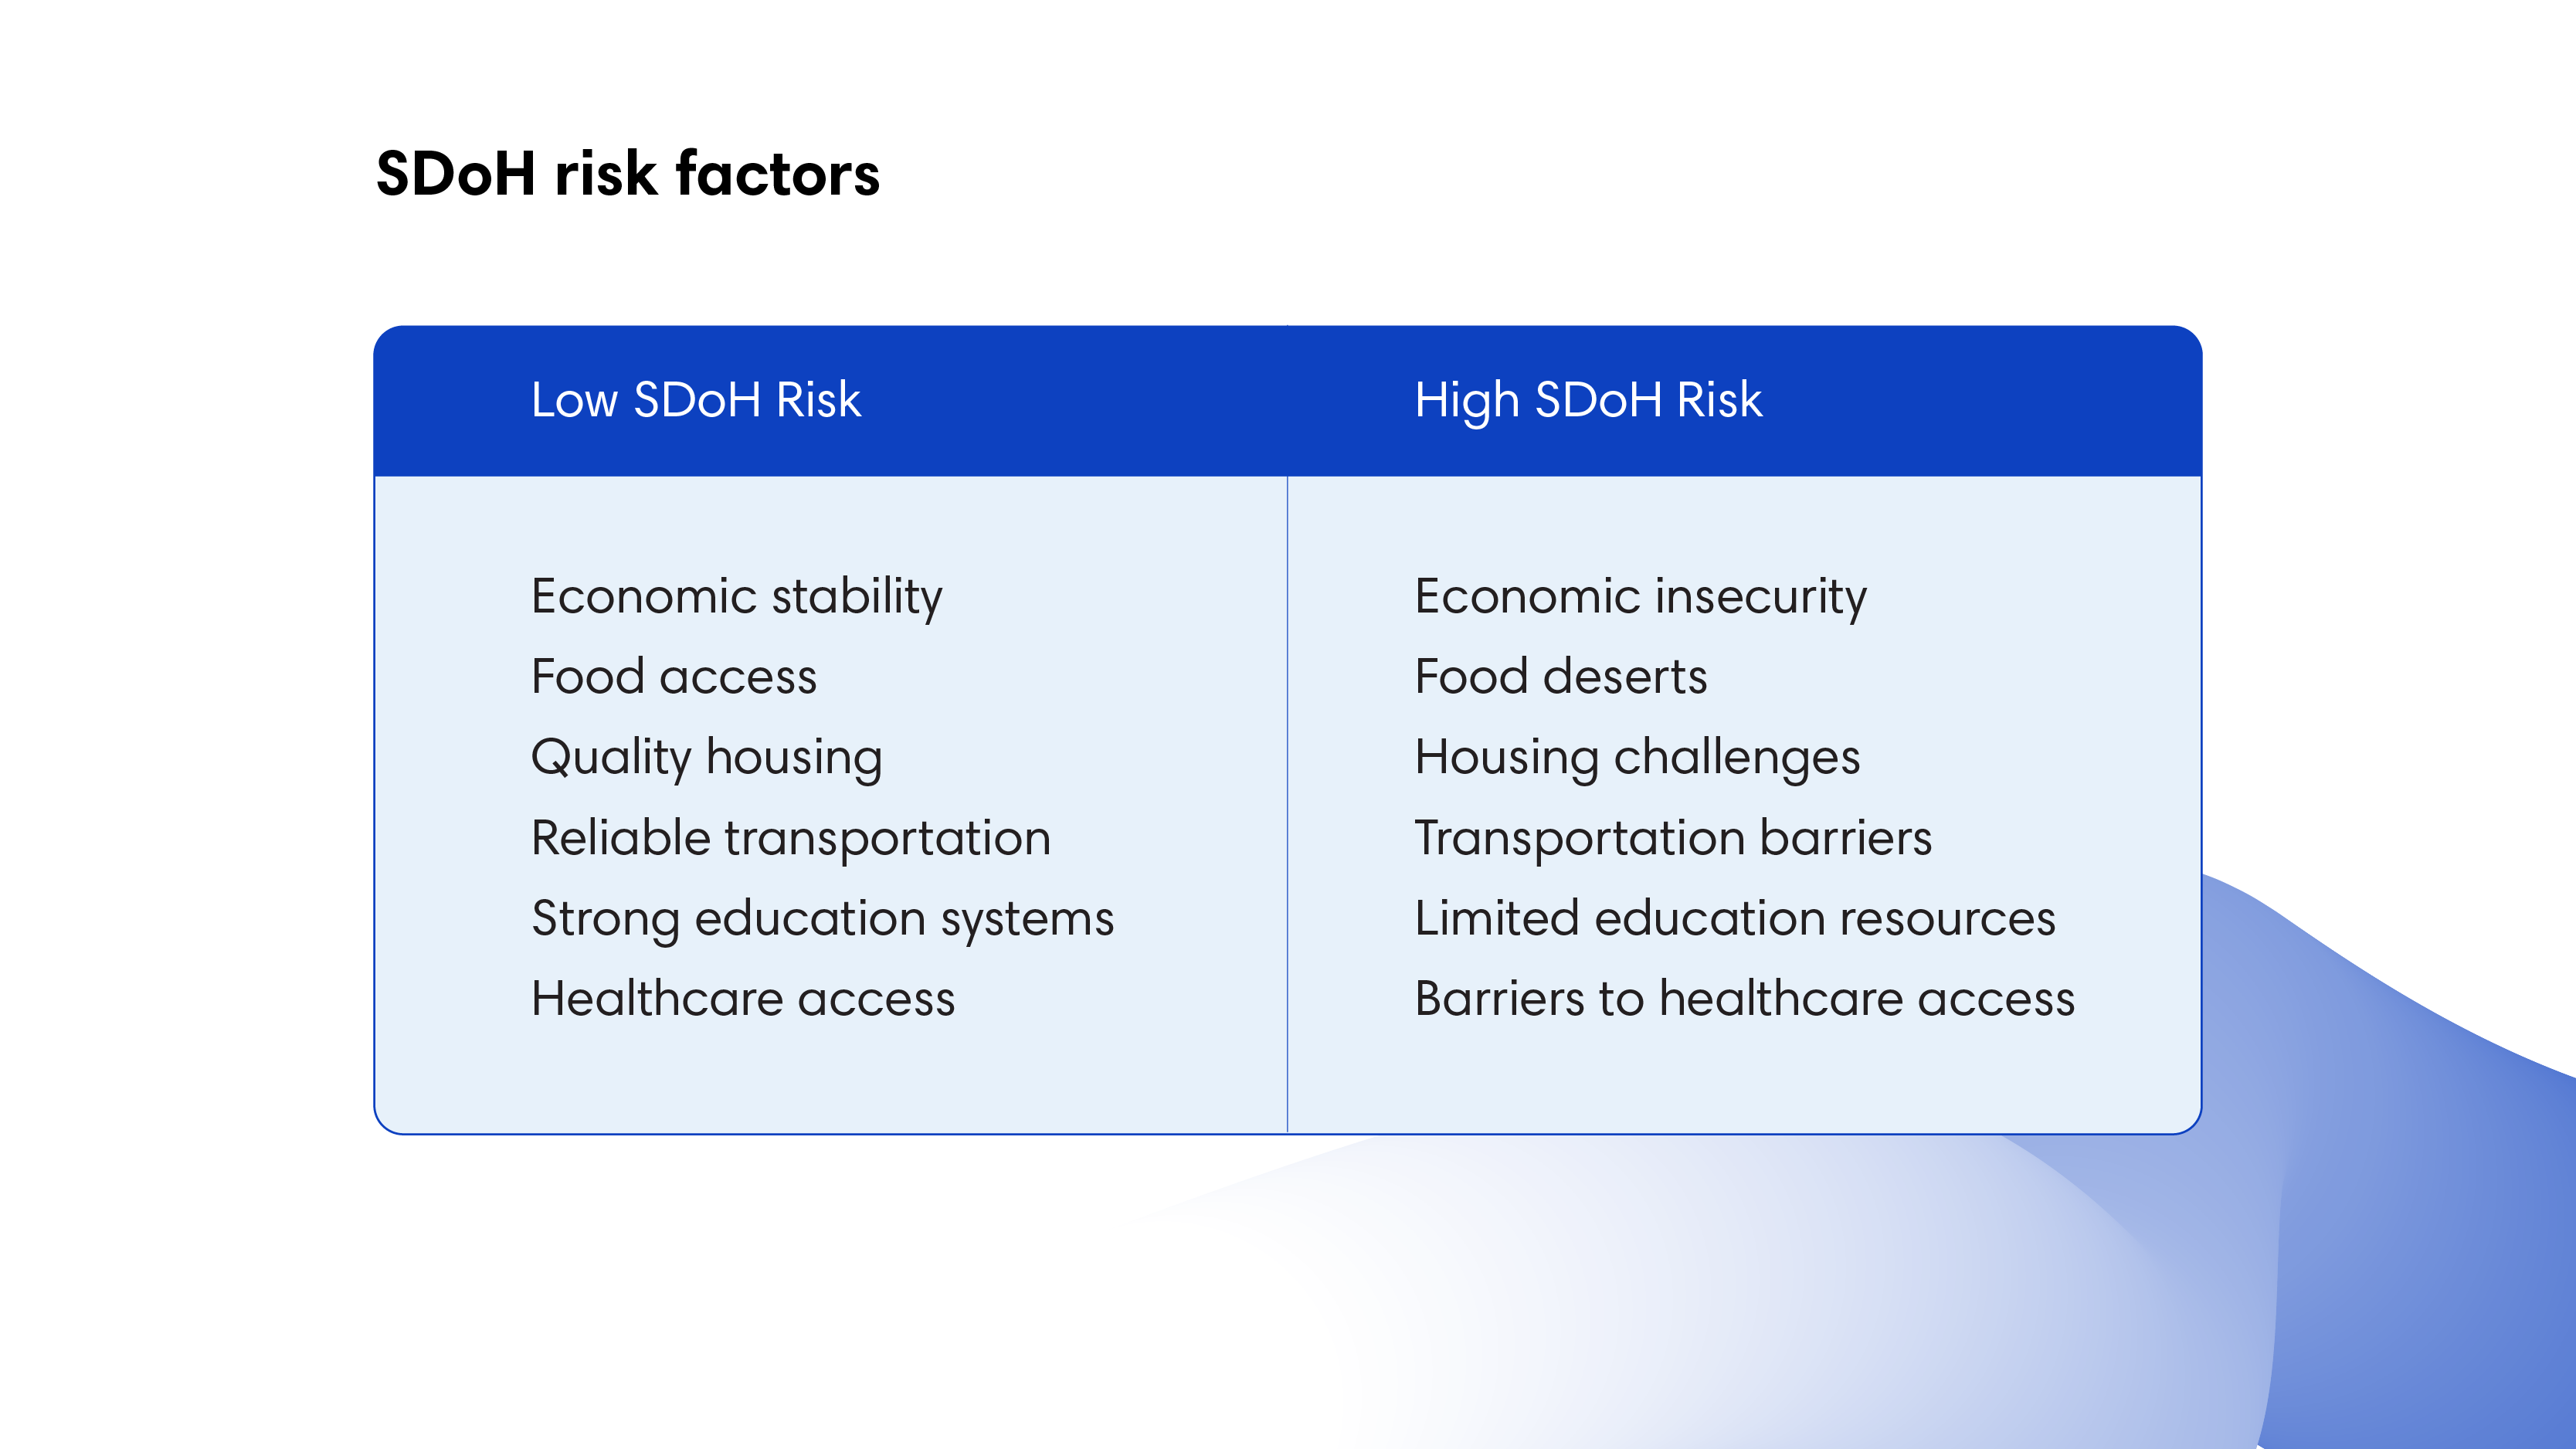
Social determinants of health (SDoH) provide our measurement framework: a score capturing economic stability, food access, housing quality, transportation access, education levels, and healthcare resources at the neighborhood level. SDoH impact doesn’t depend on income alone. Two people might earn similar salaries but live in very different environments in terms of easy access to grocery stores, transit options, or proximity to healthcare. SDoH risk scores capture that broader picture.
GLP-1 Utilization by SDoH Risk: What 5 Million Prescriptions Show
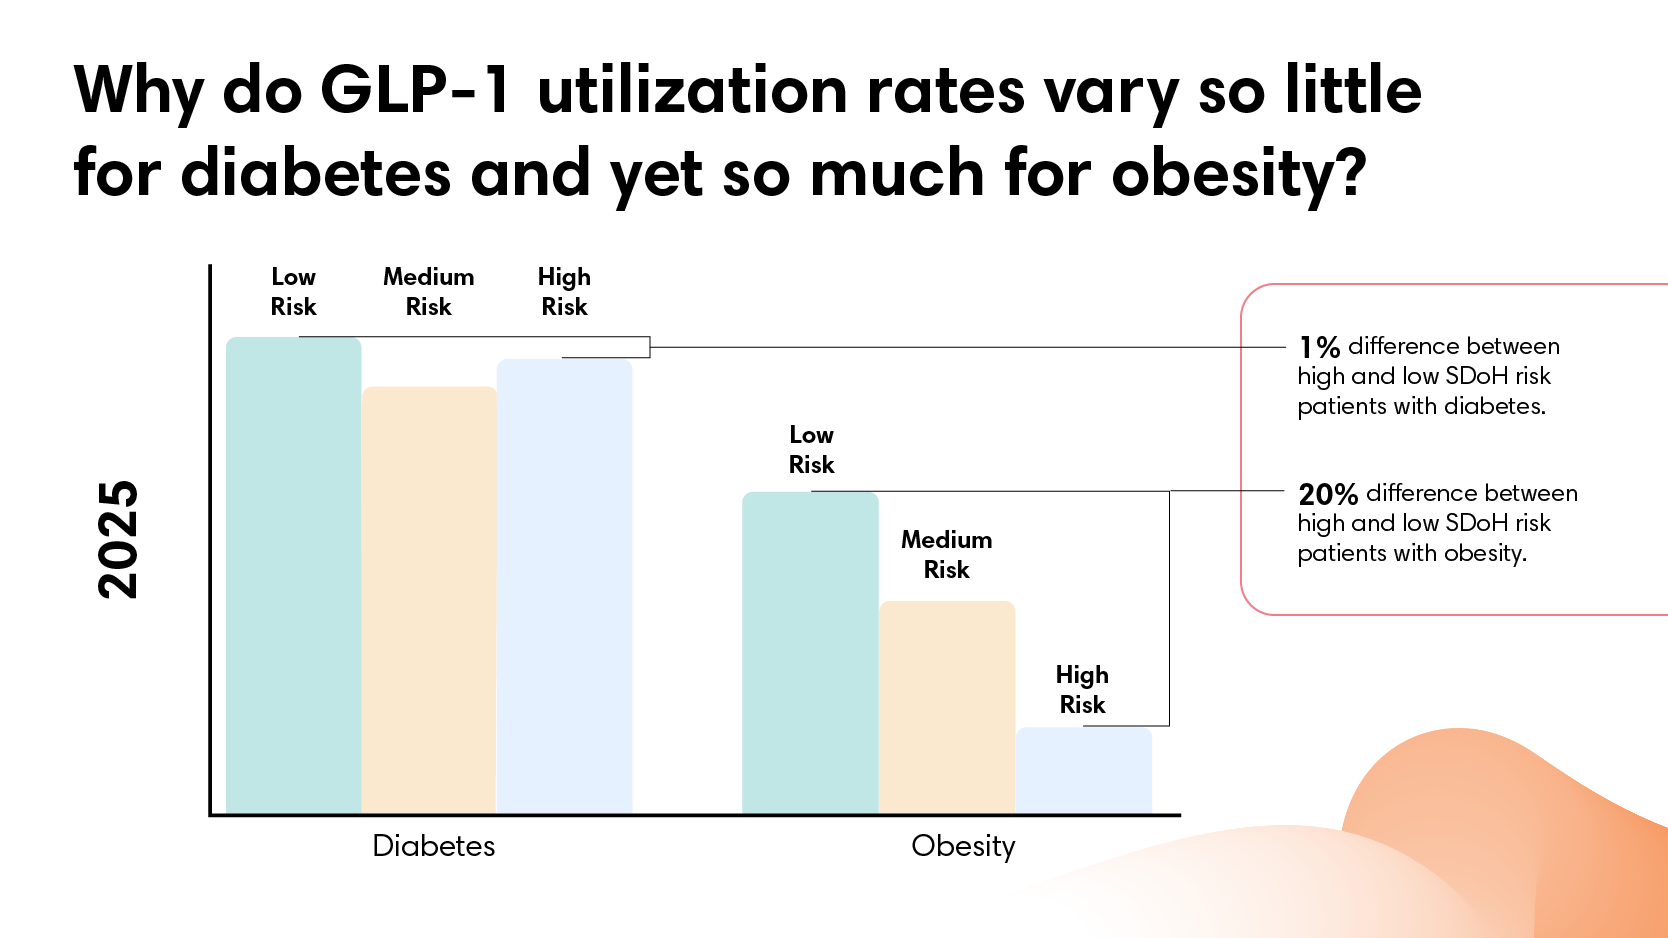
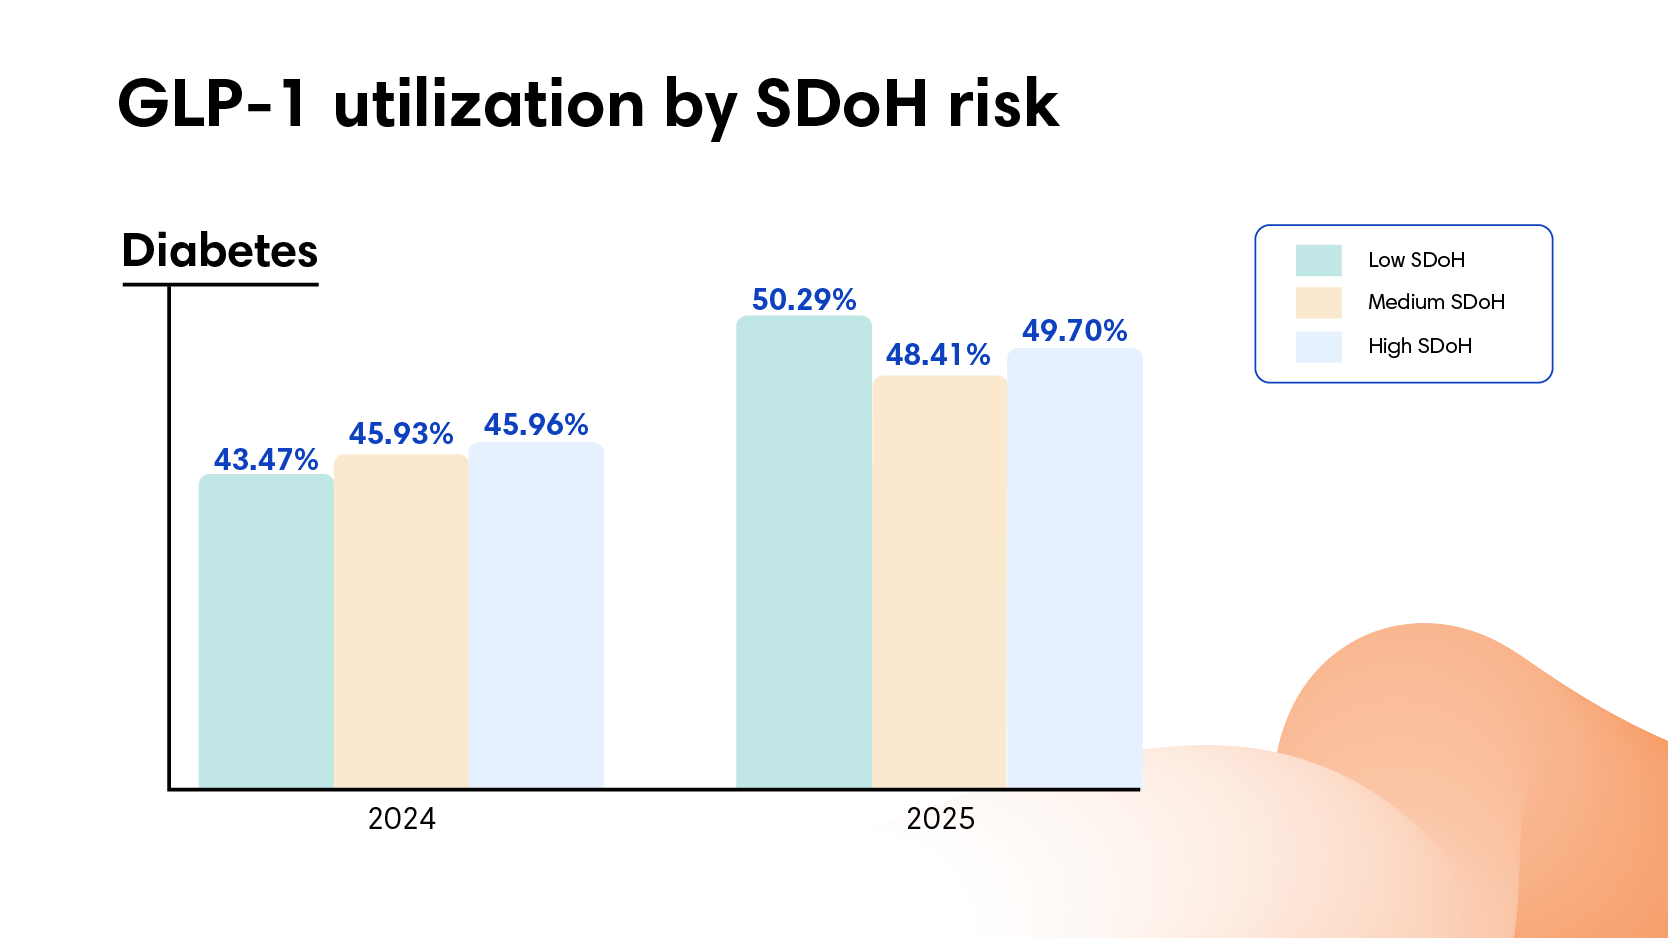
For diabetes, GLP-1 utilization was consistent across all neighborhoods. In 2024, 43% of people with diabetes in neighborhoods with lower SDoH risk filled GLP-1 prescriptions, compared to 46% in neighborhoods with higher SDoH risk. In 2025, GLP-1 utilization rates rose to 48% and 50%, respectively. No meaningful disparity. If anything, people in neighborhoods with higher SDoH risk filled prescriptions at slightly higher rates.
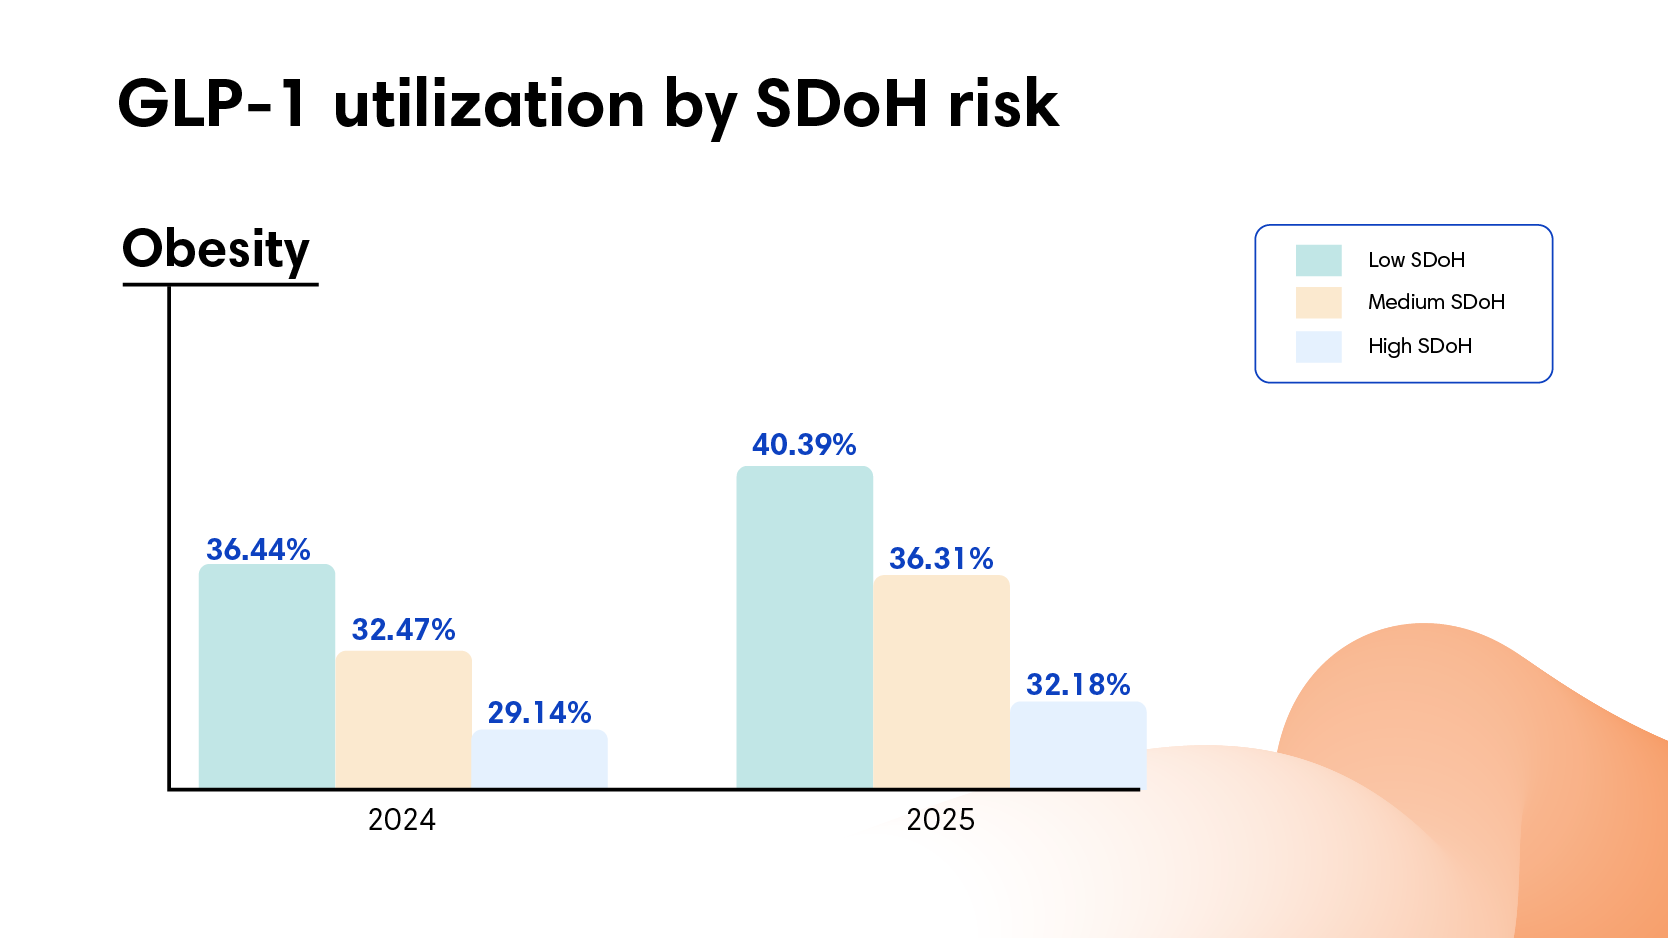
For obesity, the pattern reversed. Utilization dropped as SDoH risk increased. In 2024, 36% of people with obesity in low-risk neighborhoods filled GLP-1 prescriptions compared to 29% in high-risk neighborhoods. In 2025, utilization increased across all neighborhoods, and yet the gap persisted: 40% versus 32%. People with obesity in neighborhoods with higher SDoH risk consistently filled prescriptions at rates roughly 20% lower than those in neighborhoods with lower SDoH risk.
That divide holds steady at roughly 8 percentage points across both years. In low-risk neighborhoods, 4 out of 10 people with obesity filled prescriptions. In high-risk neighborhoods, only 3 out of 10.
Disease prevalence makes this pattern more striking. Diabetes rates run twice as high in high-risk neighborhoods (26 per 1,000 people compared to 12 per 1,000). And obesity rates run 40% higher (14 per 1,000 compared to 10 per 1,000). The populations carrying the highest disease burden show equal utilization for diabetes and lower utilization for obesity.
Why GLP-1 Coverage Works for Diabetes but Not Obesity, Even With the Same Insurance
Everyone in this dataset has employer-sponsored insurance. The diabetes pattern rules out a straightforward access problem. If high neighborhood SDoH risk generally prevented people from filling prescriptions or accessing GLP-1 medications, we'd see that pattern for both conditions. We don't.
Out-of-pocket costs are higher for obesity treatment, roughly $10-15 more per script than diabetes treatment.
However, that difference alone isn’t large enough to explain the utilization gap. Across all neighborhoods, people in high-risk areas actually pay less out of pocket for both diabetes and obesity GLP-1s than those in low-risk areas. Yet diabetes utilization stays flat while obesity utilization drops. The modest cost premium for obesity treatment likely plays a role, but other barriers must be creating the divide.
Something specific to obesity treatment drives the disparity. What that is could vary: how providers frame the treatment, prior authorization requirements, documentation needed to maintain coverage, or how patients advocate for themselves. We can't pinpoint which factors drive the gap from this data alone.
What the data does show: the pattern repeats across two years and holds steady. Diabetes treatment translates consistently from coverage to filled prescriptions. Obesity treatment doesn't.
The Cost Implications of Unequal GLP-1 Utilization for Employers
The cost implications run in two directions.
First, employers with populations in high SDoH risk areas face significantly higher GLP-1 costs overall—not because of unequal prescribing, but because of higher disease burden. They pay for 70% more GLP-1 prescriptions per capita (109 scripts per 1,000 members compared to 65 per 1,000) because twice as many people have diabetes to begin with.
Second, the obesity utilization gap may signal missed prevention opportunities. Individuals who don't receive obesity treatment today are more likely to progress to diabetes, cardiovascular disease, or orthopedic conditions that require more intensive and expensive care later. The spend isn't avoided. It's deferred and amplified.
What the GLP-1 Utilization Gap Means for Employer Health Strategy
Across two years and 5 million prescriptions, the same insurance coverage produces equal diabetes utilization regardless of SDoH risk, but unequal obesity utilization. The split reveals something specific: this isn't a general access problem. Where diabetes treatment translates consistently from coverage to filled prescriptions, obesity treatment creates gaps that follow neighborhood disadvantage.
Learn moreabout how we measure social determinants of health and why our methodology captures neighborhood context more completely.
Want to understand how neighborhood factors affect healthcare utilization in your population? Contact us.
Frequently Asked Questions
Do GLP-1 medications reach employees equally regardless of where they live?
For diabetes, yes. For obesity, no. Our analysis of nearly 5 million GLP-1 prescriptions found consistent diabetes utilization across all neighborhoods; however, an 8 percentage point gap in obesity utilization held steady across both 2024 and 2025, even among people with the same employer-sponsored insurance.
How much lower is GLP-1 utilization for obesity in higher-risk neighborhoods?
In 2025, 40% of people with obesity in lower-risk neighborhoods filled GLP-1 prescriptions compared to 32% in higher-risk neighborhoods. That's roughly 4 out of 10 versus 3 out of 10, a gap that didn't close even as overall utilization increased.
Is cost the reason for the disparity?
Not primarily. Out-of-pocket costs run about $10-15 more per script for obesity than diabetes, a real but modest difference that doesn't explain the full gap. People in higher-risk neighborhoods actually pay less out of pocket overall, yet still fill obesity prescriptions at lower rates. Something specific to how obesity treatment gets accessed, authorized, or pursued is helping to driving the divide.
Why does this matter for employers financially?
Two ways. First, employers with higher-risk populations already pay for 70% more GLP-1 prescriptions per capita because of higher disease burden. Second, the obesity treatment gap likely means deferred costs: people who don't get obesity treatment today are more likely to develop diabetes, cardiovascular disease, or orthopedic conditions later. The spend doesn't disappear. It compounds.
What should employers do with this information?
Start by understanding your own population's SDoH risk profile and whether your plan design creates equal access to obesity treatment, not just diabetes treatment. Prior authorization requirements, formulary structure, and how providers communicate about obesity medications may all be creating barriers that claims data alone won't surface.
Subscribe to Nomi's Trends in Spend
Get the latest spending trends and analysis delivered to your inbox.
{ "@context": "https://schema.org", "@type": "Article", "headline": "5 Million GLP-1 Prescriptions Reveal a Troubling Split: Equal Access for Diabetes, Not for Obesity", "description": "Nomi Health analysis of nearly 5 million GLP-1 prescriptions across two years finds consistent utilization for diabetes regardless of neighborhood disadvantage - but an 8 percentage point utilization gap for obesity that holds steady across both years, even among people with the same insurance coverage.", "image": "https://cdn.prod.website-files.com/655c259f56587d6f1221618b/698b74418bae661e79ed89ec_Blog_TIS-GLP-1_Header%201800x771.png", "author": { "@type": "Person", "name": "Dr. Rani Aravamudhan", "url": "https://www.linkedin.com/in/rani-aravamudhan/" }, "publisher": { "@type": "Organization", "name": "Nomi Health", "url": "https://www.nomihealth.com" }, "datePublished": "2026-02-12T12:00:00+00:00", "dateModified": "2026-02-12T12:00:00+00:00", "url": "https://www.nomihealth.com/trends-in-spend/what-we-learned-from-5-million-glp-scripts", "about": [ { "@type": "Thing", "name": "GLP-1 Medication Access Disparities" }, { "@type": "Thing", "name": "Social Determinants of Health" }, { "@type": "Thing", "name": "Obesity Treatment in Employer Health Plans" }, { "@type": "Thing", "name": "Self-Funded Employer Benefits Strategy" }, { "@type": "Thing", "name": "Prescription Drug Utilization" } ], "isBasedOn": { "@type": "Dataset", "name": "Artemis Employer Claims Analysis: GLP-1 Utilization by SDoH Risk 2024-2025", "description": "Analysis of nearly 5 million GLP-1 prescriptions across two years of employer-sponsored health coverage, segmented by social determinants of health neighborhood risk scores and diagnosis indication (diabetes vs. obesity).", "creator": { "@type": "Organization", "name": "Artemis, a Nomi Health company" } } }
{ "@context": "https://schema.org", "@type": "FAQPage", "mainEntity": [ { "@type": "Question", "name": "Do GLP-1 medications reach patients equally regardless of neighborhood disadvantage?", "acceptedAnswer": { "@type": "Answer", "text": "For diabetes, yes. For obesity, no. Nomi Health analysis of nearly 5 million GLP-1 prescriptions across two years found that diabetes utilization was consistent across all neighborhoods regardless of social determinants of health risk. But obesity utilization dropped as neighborhood disadvantage increased - an 8 percentage point gap that persisted across both 2024 and 2025, even among people who all had employer-sponsored insurance." } }, { "@type": "Question", "name": "How much lower is GLP-1 utilization for obesity in high-risk neighborhoods?", "acceptedAnswer": { "@type": "Answer", "text": "In 2024, 36% of people with obesity in low-risk neighborhoods filled GLP-1 prescriptions compared to 29% in high-risk neighborhoods. In 2025, utilization rose across all groups but the gap held: 40% in low-risk neighborhoods versus 32% in high-risk neighborhoods. People with obesity in higher-disadvantage areas consistently filled prescriptions at rates roughly 20% lower than those in lower-disadvantage areas - about 4 out of 10 versus 3 out of 10." } }, { "@type": "Question", "name": "Is out-of-pocket cost the reason for lower GLP-1 utilization for obesity in disadvantaged neighborhoods?", "acceptedAnswer": { "@type": "Answer", "text": "Cost alone does not explain the gap. Out-of-pocket costs for obesity GLP-1 treatment run roughly $10-15 more per script than diabetes treatment - a modest difference that is not large enough to explain the utilization disparity. Notably, people in high-risk neighborhoods actually pay less out of pocket overall for both diabetes and obesity GLP-1s than those in low-risk areas. Yet diabetes utilization stays flat while obesity utilization drops. Other barriers - how providers frame treatment, prior authorization requirements, or how patients advocate for themselves - likely contribute." } }, { "@type": "Question", "name": "Why does this GLP-1 utilization split matter for employer health plans?", "acceptedAnswer": { "@type": "Answer", "text": "The disparity has cost implications in two directions. Employers with populations in high-risk neighborhoods face significantly higher GLP-1 costs overall because of higher disease burden - 70% more prescriptions per capita (109 scripts per 1,000 members vs. 65) because twice as many people have diabetes. At the same time, the obesity utilization gap may signal missed prevention: individuals who do not receive obesity treatment today are more likely to progress to diabetes, cardiovascular disease, or orthopedic conditions. The spend is not avoided - it is deferred and amplified." } }, { "@type": "Question", "name": "What is the relationship between social determinants of health and GLP-1 prescription rates?", "acceptedAnswer": { "@type": "Answer", "text": "Social determinants of health (SDoH) risk scores capture neighborhood-level conditions including economic stability, food access, housing quality, transportation, education, and healthcare resources. Nomi Health found that SDoH risk predicted obesity GLP-1 utilization but not diabetes utilization - suggesting that neighborhood context creates specific barriers to obesity treatment that do not affect diabetes treatment equally. Disease burden is also higher in disadvantaged areas: diabetes rates run twice as high and obesity rates 40% higher in high-risk neighborhoods." } }, { "@type": "Question", "name": "Does having insurance eliminate GLP-1 access disparities by neighborhood?", "acceptedAnswer": { "@type": "Answer", "text": "Not for obesity. Everyone in the Nomi Health dataset had employer-sponsored insurance, and yet the obesity utilization gap persisted across both years. The diabetes pattern rules out a general access problem - if high neighborhood SDoH risk broadly prevented prescription fills, both conditions would show the disparity. The fact that it appears only for obesity points to something specific about how obesity treatment is accessed, authorized, or pursued compared to diabetes treatment." } }, { "@type": "Question", "name": "What can employers do about GLP-1 utilization disparities in their workforce?", "acceptedAnswer": { "@type": "Answer", "text": "Employers can start by understanding their own population's SDoH risk profile and GLP-1 utilization patterns by diagnosis. Nomi Health data shows that the obesity utilization gap persists even when insurance coverage is equal, suggesting that plan design, prior authorization requirements, and provider communication may be creating barriers specific to obesity treatment. Employers with populations in higher-risk neighborhoods should examine whether their benefit structure supports equal access to obesity treatment — not just diabetes treatment — and whether current spend patterns reflect deferred costs that will surface later as more expensive conditions." } } ] }
[ { "@context": "https://schema.org", "@type": "ScholarlyArticle", "name": "GLP-1 Receptor Agonist Order Fills and Out-of-Pocket Costs by Race, Ethnicity, and Indication", "description": "A JAMA Health Forum cohort study examining how often GLP-1 receptor agonist orders are filled, out-of-pocket costs per prescription, and differences by race, ethnicity, and diagnosis indication among insured patients - cited in this post for context on GLP-1 access patterns among insured populations.", "url": "https://jamanetwork.com/journals/jama-health-forum/fullarticle/2839914", "publisher": { "@type": "Organization", "name": "JAMA Health Forum" } }, { "@context": "https://schema.org", "@type": "ScholarlyArticle", "name": "Not All SDoH Indices Are Created Equal", "description": "An Artemis Health analysis explaining why different social determinants of health measurement methodologies produce different results, and how Artemis captures neighborhood context more completely than standard indices - cited in this post as the methodology underlying Nomi Health's SDoH risk scoring approach.", "url": "https://www.artemishealth.com/blog/not-all-sdoh-indices-are-created-equal", "publisher": { "@type": "Organization", "name": "Artemis Health" } } ]